
This blog post highlights 35 amazing statistics from the fabulous We Are Social Global Digital Statshot August 2015 SlideShare (80 701 views) using two infographics. The We Are Social Global Digital StatShot SlideShare presents 43 very edifying statistics as of August 2015. The infographics present 40 of the 43 statistics as 35 statistics. Ten of the statistics are illustrated as 5 index numbers.
This post is an August 2015 update of the Stats Cosmos
Global Social Media landscape architecture introduced in two previous blog
posts and the recently launched screencast series.
The blog posts are:
- A list of A list of One hundred statistics embodying the global social media landscape
- The Regional Digital, Social, and Mobile in 2015 statistics list that every blogger, writer or internet (content) specialist should take a look at to get a good mathematical basis from which to formulate social media and digital statistical content
- Social Media Data Analysis Screencast series
The approach taken in the post will be, firstly, to
introduce the architecture’s statistical population, namely, the global
population. The second step will be to present the year on year comparisons
which the 10 statistics are presented as year on year change index
numbers in the infographics. The next final step will be to present the three
statistics from the Global Digital August 2015 StatShot SlideShare that are not included
in the infographics. The last and final step will be to present the two
infographics, Hipster and Data Geek, constructed using the marvelous Hubspot
infographics template.
1. Global population (Summary)
Slide 2 presents the global population, its accompanying sub-populations
and characteristics. The sub-populations are active internet users, active social
media users, unique mobile users and active social media users. The
characteristics are the resulting penetrations and the level of urbanization.

The landscape architecture global population estimates use
the Internet World Stats database as the source database. The landscape
architecture is updated according to the Internet World Stats database
snapshots. The statistical population modeling within the landscape
architecture use the Salesforce Marketing Cloud estimates and the We Are Social
estimates as controls. The statistical
modeling is conducted within the Udemy College Introduction to Website Survey Sampling course framework. The Introduction to Website Survey Sampling course
framework includes the Revolution R Open and SAS OnDemand for Academics
software bundles.
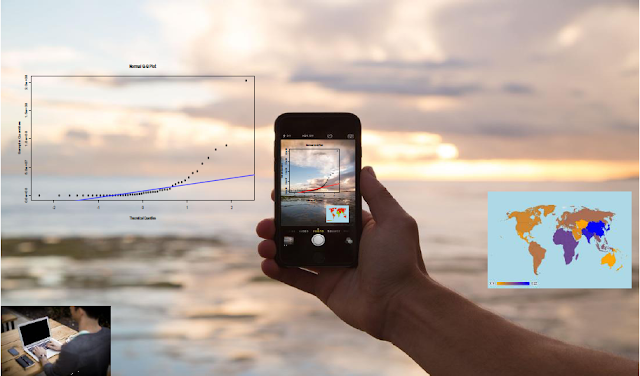
The following summary statistics and Quantile-Quantile (QQ)- plot from the SAS software Proc univariate procedure were obtained. The value of 0 in the
dataset refers to a territory where no data is available at present.


The accompanying Quantile-Quantile (QQ) -plot shows that, as expected, the distribution of the population sizes is skewed to the right.

The QQ-plot of the log transformation of the data shows a
closer correspondence to normality.

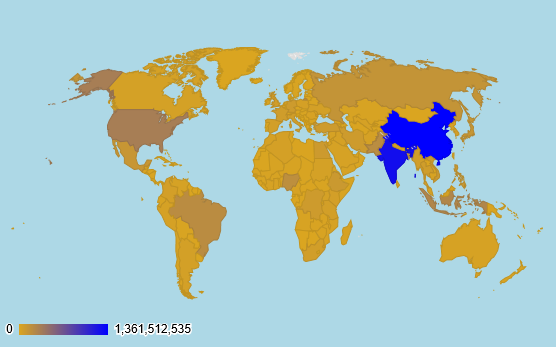
The population estimates can also be presented using the Revolution R Open gvisGeoChart function from the googleVis package.
2. Global population year or year growth properties
Slide 3 presents the year-on-year growth characteristics of
the global population and its constituent sub-populations.

The interesting message of this slide are the sizes of the
percentages. The global population is growing at a rate of 2.5% and the number
of unique mobile users at 3.5%. This
means that the acquisition of new cellphones is growing faster than the
population is growing. The first exciting Internet of Things development is the
growth of 7.6% growth in internet users which implies an increasing global
internet penetration. These developments are in line with the observations in
the Stats Cosmos architecture, Internet World Stats database, Salesforce Marketing
Cloud data, We Are Social data, and the Ericsson Mobility Report data (from the Ericsson Mobility Report website).
Additionally, they are in line with the Ericsson Mobility Report forecasts.
The next interesting features are the social media and
mobile social media percentages of 8.7% and 23.3% which indicate increasing
social media penetration and mobile social media penetration. The two
developments are explicitly highlighted by the Global Digital We Are Social
SlideShares:
- Digital, Social and Mobile in 2015 SlideShare
- Social, Digital and Mobile Around The World Slide Share (Global Digital Statistics 2014)
The developments are also
highlighted from a technological perspective in the Ericsson Mobility Report (June 2015) SlideShare. The Ericsson Mobility Report (June 2015) and its accompanying SlideShare also
include forecasts up to the year 2020.
Absolutely amazing and exceptional.
3. Social Media platforms not included in the Infographics
Slide 3 provides a comparison of active users by social platforms. The comparison is two dimensional in that it includes both the social networks and Messenger/Chat App/VOIP markets. The three statistics not included in the Infographics but included in the Stats Cosmos global social media landscape modeling architecture are the active users of the social media platforms YY, Vkontakte and LinkedIn.

The reason the statistics were not included was because the Infographics looked to present the users of the Top Eight Social Media platforms as a non-parametric statistic. The statistic has, however, been analogously computed for the top ten in the Stats Cosmos global social media landscape modeling architecture presented in the blog posts and screencast series.
4. Infographics Hipster and Data Geek


The developments in the global digital and social media industries are amazing. They are shaped by wonderful technological developments in the form of the Internet of Things, big data and technology. From an academic blogging perspective they provide an excellent learning, content creation, content management and business management resource. Additionally, this trend is forecasted to be a major influence in the evolution of the global digital space for the next six years. You and your fellow internet users can easily become a part of it, or better still, influence it through the your own blogs, the Stats Cosmos blog and the internet generally.
Want to check out more digital and social media material from Stats Cosmos blog?
Check out our other blog posts and screencast series.


Subscribe to our RSS feeds for blog material updates.
Blog post RSS feeds

Screencast series RSS feeds

Or get a 25% discount to our training opportunity bundle


Also check out the Hubspot for tons of resources, offers, infographics templates, tutorials, subscriptions and other wonderful blogging maters.
No comments:
Post a Comment
Thank you for your comment.